Introduction
Beginning approximately 05:00 Sat Jan 25 2003 GMT (21:00 Fri Jan 24 2003 PST), a new MS-SQL Server Worm began propagating through the Internet. The "slammer" worm infected hosts by targeting a known buffer overflow vulnerability in Microsoft SQL Server. Infected hosts generate a high volume of malicious worm probe traffic to UDP port 1434. Traffic congestion led to denial of service against many hosts and network infrastructures. We capture worm traffic from a peering exchange point over the period of a week. We analyze the worm traffic rate, source infection rate and lifetime, source domain distribution, source and destination distribution within the IP address space and per-host contribution to packet totals. Details of the "MS-SQL Slammer" worm and defensive actions are given in [1], [2], [3]. Additional traffic analysis of the worm is available from CAIDA [4].
To monitor and analyze the worm, we began capture of all UDP port 1434 traffic within a United States peering exchange at approximately 21:20 Sat Jan 25 2003 GMT (13:20 PST). Unfortunately we did not begin capture until approximately 16 hours after the first reports of the worm. However, we capture the worm in the height of its activity and also observe its behavior over time. The exchange is a mesh of switches connected by high-speed links. We monitor one direction of traffic on two different links. We do not sample, but rather capture every UDP 1434 packet. We only capture the packet headers (no payload). The trace we describe here captured 31453s (~524m) of data. Anonymized, prefix-preserving [8] versions of these traces are available in the traces section. Table 1 provides specifics of the data.
| Link | Packets | Bytes | Avg Pkt Size | Avg Pkts/s |
|---|---|---|---|---|
| 0 | 20417849 | 8248651136 | 404.0 | 649.1 |
| 1 | 10606401 | 4285393413 | 404.0 | 337.2 |
Analysis
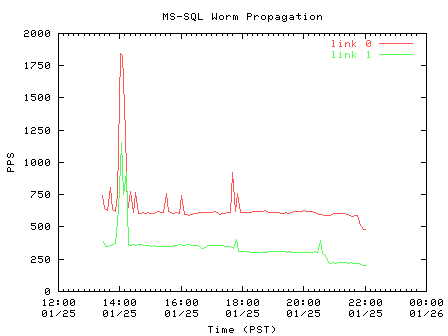
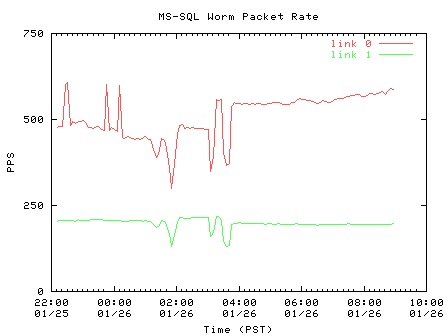
We first observe the rate of worm probes as a function of time over the duration of the trace in Figure 1. The normal packet rate on each link in the exchange point ranges between 15-40k packets-per-second (pps). Thus, the worm accounts for less than 10% of the packet volume on our monitored links.
|
|
| Figure 1. Packet per second (5-minute aggregates) rate of worm probes |
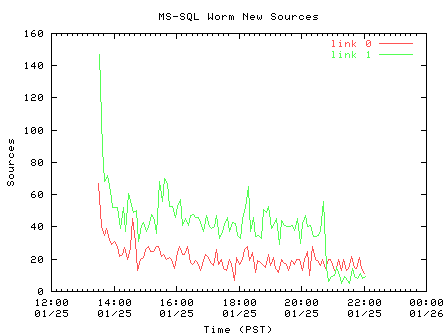
Table 2 shows the number of unique source and destination IP addresses in the trace. To understand the propagation of the worm, we plot the number of new, unique source IP addresses seen on each direction of the link in Figure 2.
| Link | Unique Sources | Unique Destinations |
|---|---|---|
| 0 | 2523 | 15710620 |
| 1 | 5321 | 5602059 |
|
| Figure 2. Appearance of new unique sources (5-minute aggregates) |
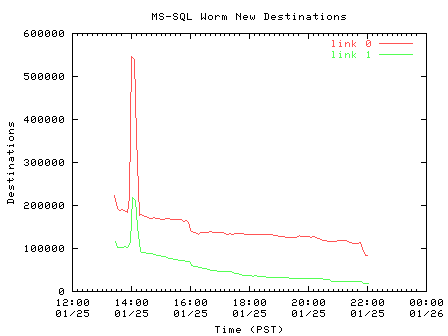
Figure 3 plots the appearance of new, unique destination IP addresses. Because of the worm's pseudo-random destination address selection, we see a much larger proportion of destinations per five-minute interval than sources. The rate of new destinations decreases slowly over the duration of the trace.
|
| Figure 3. Appearance of new unique destinations (5-minute aggregates) |
We wanted to understand the extent of the worm's probing. An effective way to visualize the worm's activity is to graphically depict the areas of the 32-bit address space to which our trace saw activity. To generate a meaningful image (a 2 dimensional representation of the 32-bit space is too large), we employ Braun's technique [5], later used by McCreary [6]. We look at only the 24 most significant bits of each source or destination address, leaving 2^24 possible subnetworks. The image can then be generated as a 4096x4096 pixmap with each pixel representing as many as 256 individual hosts. Table 3 provides the number of unique source and destination /24 netblocks for each direction of the link. Figures 4 and 5 are visualizations of the worm's attack space. Note that the small number (1000's) of /24 netblocks with attacking hosts produces almost blank spaces in Figure 5.
| Trace | Destination /24s | Source /24s |
|---|---|---|
| 0 | 877595 | 1575 |
| 1 | 122980 | 3626 |
| * Click on any image to retrieve the full 4096x4096 original | |

| 
|
| Figure 4(a) Distribution of Worm Destinations on Link 0 | Figure 4(b) Distribution of Worm Destinations on Link 1 |

| 
|
| Figure 5(a) Distribution of Worm Sources on Link 0 | Figure 5(b) Distribution of Worm Sources on Link 1 |
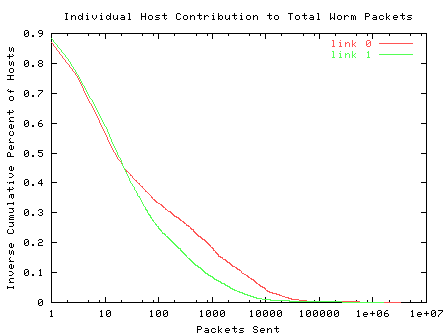
We plot the inverse cumulative contribution of individual sources to the total probe traffic for each link in Figure 6. Approximately 50% of the sources we observed generated 10 worm packets or less; 11% contributed only a single packet to the trace. Approximately 10% sent more than 1000 worm packets that were seen by our monitor. However, the largest contributing source on links 0 and 1 sent 3,286,703 and 1,585,961 (16.1 and 15.0 percent of the total) worm packets respectively.
|
| Figure 6. Individual Source Contribution to Worm Packets |
We performed DNS lookups on each source in the traces and determined its top-level domain (TLD). Table 4 lists ordered host infections in each TLD. Hosts that did not have a reverse mapping are listed as "unknown." In both traces, .net and unknown are the largest domains infected. Approximately 50% of the infected hosts on link 1 resolved to .net while 75% on link 0 resolved to .net.
|
| ||||||||||||||||||||||||||||||||||||||||||||||||||||||||||||||||||||||||||||||||||||||||||||||||||||||||||||||||||||||||||||||||||||||||||||
24 Hours Later
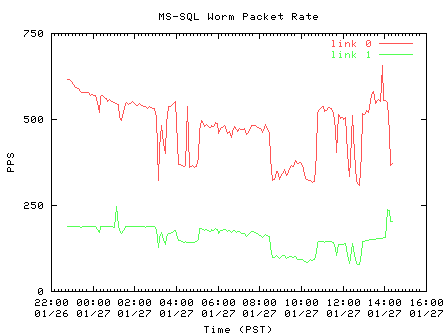
We gathered traces throughout the weekend to into Monday, January 27 2003. As Figure 7 shows, the rate of worm probe traffic decreased over time on both links. Despite the fact that the worm attacked MS-SQL servers, which would typically represent continually operational hosts, we see time of day patterns in the probe rate. We speculate that the diurnal pattern is partly due to administrators patching or powering off compromised servers during the day. However, patching the vulnerability does not explain the increase in worm traffic during particular hours.
| 
|
| Figure 7. Packet per second rate of worm probes | |
One Week Later
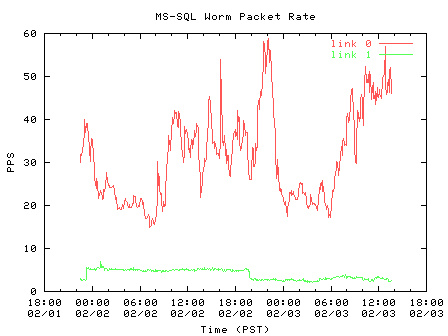
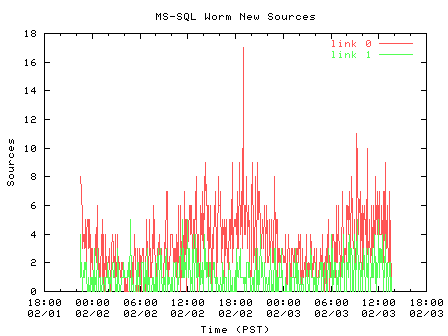
By February 3rd 2003 the worm's traffic had decreased by an order of magnitude, but was still active as seen in Figure 8. Figure 8 shows stronger diurnal cycles, suggesting that these infected machines were not continually powered on. Most surprising was the rate of new sources a week after the initial outbreak. While the worm infected the majority of hosts within 10 minutes [4], we see 0-10 packets from new sources every 5 minutes (a new source is the source IP of a worm packet that we have not observed thus far in our week's traffic collection). Figure 9 shows the rate of new sources.
| 
|
| Figure 8. Packet per second rate of worm probes, one week after outbreak | Figure 9. Rate of new sources (5-minute aggregates) |
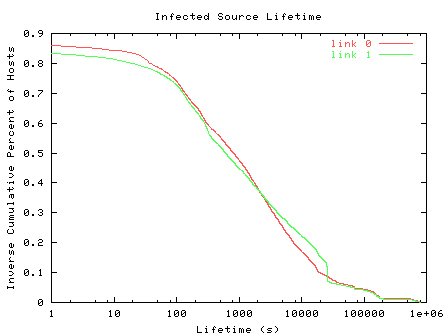
Finally, we observe the lifetime of infected sources. During the entire capture period, we timestamp each new source and extend the lifetime (update the ending timestamp) of sources with existing state for each worm packet passing through the monitor. We record only a single packet (zero lifetime) from approximately 15% of the sources and find a maximum lifetime of approximately 9 days. Figure 10 shows the inverse cumulative proportion of hosts relative to the lifetime of the infected source. 95% of the sources were infected for less than a day; 70% of the sources were infected for less than a hour. Note that these lifetimes are under-estimates because a source may still be active but the random destination addresses it sends to are not routed across our monitoring point.
|
| Figure 10. Infected Source Lifetime |
The following prefix-preserving anonymized traces of slammer activity from this study are publicly available here (specific tcpdpriv options were -A50 -P99). These are libpcap formatted files (i.e. tcpdump) compressed with bzip2. Please acknowledge this work when using these traces.
| File | Link | Packets | Bytes |
|---|---|---|---|
| mssql-20030125-0.priv.bz2 | 0 | 20417849 | 8248651136 |
| mssql-20030125-1.priv.bz2 | 1 | 10606401 | 4285393413 |
References
[1] CERT, "Advisory CA-2003-04 MS-SQL Server Worm".
[2] Symantec, "
W32.SQLExp.Worm Security Response".
[3] NGSSoftware, "Unauthenticated Remote Compromise in MS SQL Server 2000".
[4] David Moore, Vern Paxson, Stefan Savage, Colleen Shannon,
Stuart Staniford and Nicholas Weaver, "
The Spread of the Sapphire/Slammer Worm".
[5] Hans-Werner Braun,
http://moat.nlanr.net/IPaddrocc/,
"BGP-system usage of 32 bit Internet address space",
15 November 1997 (December IETF plenary presentation).
[6] Sean McCreary and kc claffy,
http://www.caida.org/outreach/resources/learn/ipv4space/,
"IPv4 Address Space Utilization", 27 August 1998.
[7] David Moore, Colleen Shannon, Jeffery Brown,
"Code-Red: a case study on the spread and victims of an Internet worm",
Proceedings of the Second the ACM Internet Measurement Workshop, 2002.
[8] Greg Minshall,
http://ita.ee.lbl.gov/html/contrib/tcpdpriv.html,
"Program for Eliminating Confidential Information from Traces".
| Analysis by: Rob Beverly, 01/27/2003 - 02/04/2003 | |
| Questions/comments welcome at: | 
|

